
Global Container Shipping & Logistics Sector
Illustrative Case Study
"Meridian Container Lines” is A fictional global container shipping and logistics group created to test an end-to-end finance leadership mandate in a complex, multi-entity and multi-currency operating environment.
- Who is the Company?
A composite shipping and logistics group with regional operations, vessel activity, agency businesses, terminal interests and joint arrangements. It is not a real company and does not reproduce any employer's information.
What Data Do I Use?
Synthetic FY2026 P&L, budget and forecast data; volume and rate drivers; balance sheet and cash-flow schedules; entity, currency and consolidation views; IFRS review materials and management reporting outputs.
What Role Am I Performing?
I act as the finance leader: validate the model, test reconciliations, diagnose performance, apply accounting judgement, prepare the executive narrative and translate findings into owners, deadlines and governance actions.
What Am I Trying to Answer?
What changed? Why did it change? Is it market-driven or controllable? Is the accounting presentation right? What decision is required, who owns the response and how will Finance verify the outcome?
Disclaimer: "Meridian Container Lines" is a composite, illustrative entity, not any single real company. The uploaded Hapag-Lloyd press release was used only as a reference for how a real listed carrier structures and discloses its results — none of Hapag-Lloyd's actual figures are reproduced or represented as this company's results. All monthly volumes, rates, cost ratios, balance sheet balances and subsidiary figures in this workbook are synthetic, calibrated to sit within public market ranges. No employer, client, or confidential data is used.
Data Lab Generated within this Composite Entity
Data "Meridian Container Lines"
Inputs
Every driver behind the numbers: revenue (volume/rate/gross-to-net), direct operating cost, SG&A by region, balance sheet opening position, working capital, capex, debt and dividend policy, and the subsidiary/JV portfolio. Including the annual budget assumptions & actual monthly drivers.
P&L | SG&A Detail | Balance Sheet | Cash Flow
Monthly Jan-Dec 2026 (Jan-May actual, Jun-Dec rolling forecast), rolled to a full-year total and compared to the original FY2026 budget.
The group's SG&A broken out by region (Europe, Asia-Pacific, Americas, Middle East & Africa) and cost category.
Opening position at 1 Jan 2026 vs. forecast closing position at 31 Dec 2026, built from the P&L and working-capital/capex/debt assumptions.
Controls: Indirect-method statement bridging net income to the change in cash, ties exactly to the Balance Sheet's cash movement.
Statement of Changes in Equity | Subsidiaries & JV's
Controls: opening equity to closing equity via net income and dividends, ties exactly to the Balance Sheet's equity line.
A portfolio view of the group's entities with a revenue-vs-margin scatter chart to spot top performers and loss-makers at a glance.
How I Analyse the Company?
01 Validate the Financial Data
Check formula logic, source mapping, tie-outs, completeness, cut-off and classification before interpreting performance.
02 Diagnose the Drivers & Economics
Decompose rate, volume, mix, cost and leakage; separate structural market effects from controllable management actions.
03 Apply Accounting and Risk Review
Test IFRS presentation, consolidation, impairment and control implications; flag unsupported conclusions rather than inventing data.
04 Turn Findings into an insights decision
Lead with the so-what, quantify exposure, define options and recommend the action required from the CFO or Executive Committee.
05. Embed Execution and Accountability
Assign owners, deadlines, thresholds, KPIs and governance cadence so the response is verified in the next forecast and close.
Data Summary - Consolidation
The group's FY2026 KPIs pulled from every statement created.
Why I created the Data Lab (Composite Entity)
Governing PILLARS
Senior finance hiring should not rely only on titles, credentials or résumé bullet points. I created this laboratory so an employer can inspect how I structure a model, reconcile the numbers, challenge missing information, distinguish economic performance from accounting classification and convert analysis into an executive decision.
The purpose is not to present a polished dashboard in isolation. It is to demonstrate the complete reasoning chain behind the dashboard: the source data, the control checks, the operating drivers, the accounting judgement, the management implication and the follow-through required after the meeting.
What does management need to understand or do differently because of this analysis?
Model
Build an auditable, driver-based operating model
Control
Reconcile the ledger logic and accounting presentation.
Diagnose
Explain the economic and operational drivers.
Advise
Present the so-what, options and recommendation.
Execute
Translate findings into cross-functional action.
Govern
Track ownership, thresholds and follow-through.
MERIDIAN CONTAINER LINES . CS01 . FP&A + EXECUTIVE REPORTING
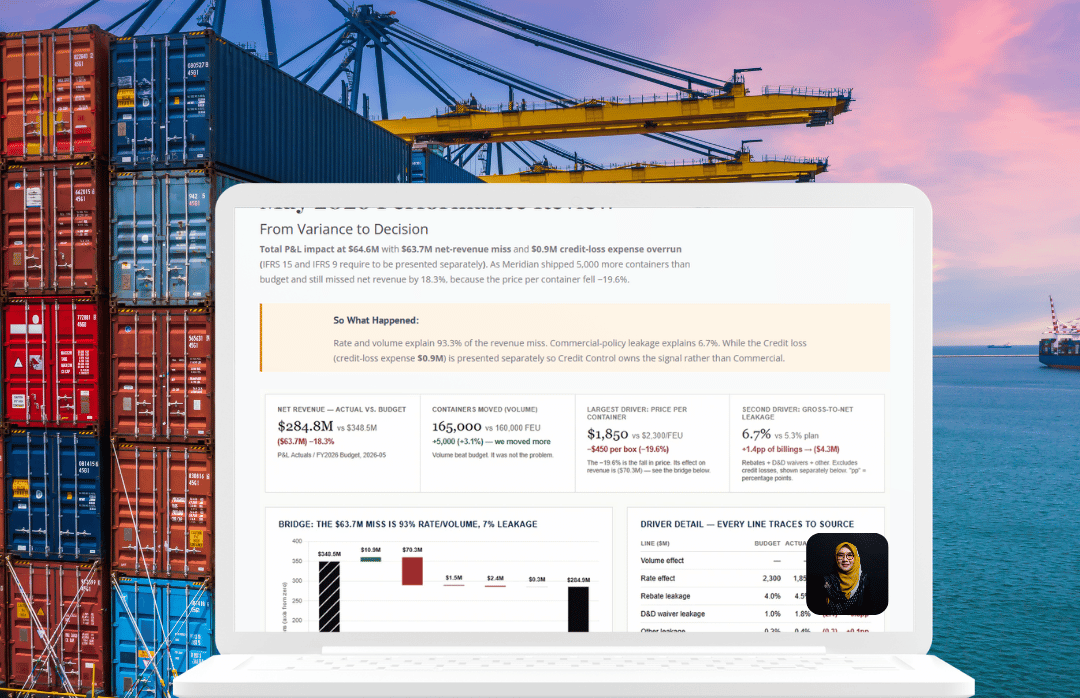
May 2026 Performance Review
From Variance to Decision
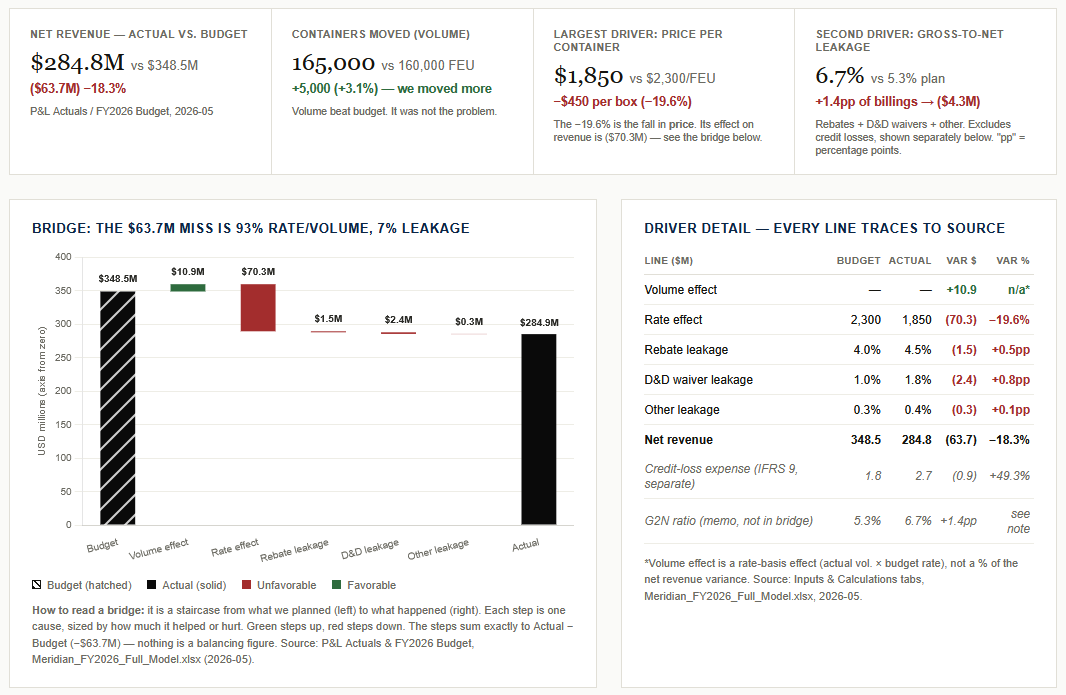
Total P&L impact at $64.6M with $63.7M net-revenue miss and $0.9M credit-loss expense overrun (IFRS 15 and IFRS 9 require to be presented separately). As Meridian shipped 5,000 more containers than budget and still missed net revenue by 18.3%, because the price per container fell −19.6%.
So What Happened:
Rate and volume explain 93.3% of the revenue miss. Commercial-policy leakage explains 6.7%. While the Credit loss (credit-loss expense $0.9M) is presented separately so Credit Control owns the signal rather than Commercial.
Why did the price fall while the volume grew?
Supply outran demand. Fleet capacity grew faster than cargo volumes through 2025–26, and in shipping that gap transmits into price almost immediately
Asia–Europe accounts for 59.4% of the total rate effect: −$44.9M of −$75.6M. Asia–North Europe alone is −$29.6M (39%), with rates down 28.6%.
Cross-functional View
The rate cycle is a commercial and network decision. The controllable $4.3M of revenue leakage, plus a separate $0.9M credit-loss overrun, sits inside four functions. Each card below shows what May's numbers mean for that team and what to plan differently next month.
Commercial & Trade Management
-$70.3M rate effect
Spot rates fell to ~$1,850/FEU against a $2,300 budget as fleet overcapacity outpaced demand.
Every contract renewed at spot-linked pricing this quarter locks in the lower rate for its full term.
Accelerate long-term contract coverage on lanes still above spot; hold spot exposure only where rates are expected to recover.
Network & Capacity Planning
+$10.8M volume effect
Volume ran 5,000 FEU above budget, we chased cargo to fill ships in a soft market.
Extra volume without matching capacity discipline is what's pushing rates down further for everyone, including us.
Coordinate blank-sailing and deployment decisions with commercial before the next round of volume-chasing discounts.
Customer Service & Documentation
-$2.4M D&D leakage
Demurrage & detention waivers granted at the counter rose from 1.0% to 1.8% of gross billings.
Waivers you approve to keep a customer happy this month are showing up as a real, recurring revenue leak.
Introduce a waiver approval threshold above $2,000 and report waiver rate by branch monthly.
Credit Control & Shared Services
-$1.2M bad debt leakage
Doubtful-revenue provisioning rose from 0.5% to 0.9% of gross billings as smaller forwarders come under margin pressure.
The soft market is a leading indicator of counterparty stress before it shows up as a formal write-off.
Review credit limits for accounts over 60 days past due this week, not at quarter-end.
Equipment& Container Inventory
Linked to D&D waivers
Waiving detention removes the customer's incentive to return containers quickly.
Container turnaround is likely slowing in the same lanes where waivers are concentrated — check dwell time, not just the revenue line.
Tier the waiver policy to container availability by depot, so we don't waive our way into an equipment shortage.
Procurement & Fleet Management
Margin compression
EBITDA margin is compressing as the rate cycle turns, this bridge doesn't touch cost, but the budget headroom just got smaller.
Discretionary spend will get more scrutiny next quarter if the rate cycle doesn't turn.
Flag which drydock and procurement commitments are safety-critical vs. deferrable, before finance asks.
How I Think & Analyse

Diversity in Finance Teams Is Not About Being Nice. It Is About Seeing Risk Earlier.
A practical finance-leadership framework for turning diverse teams into stronger control, reporting, and decision systems.

AI-Augmented Finance: A Practical CFO Framework for Using AI Without Losing Control
A finance-leadership framework for applying AI to forecasting, reporting, accounting research, controls, and executive decision support, without turning finance into a black box.

Finance Leadership Is Not Reporting the Past Beautifully
A practical leadership framework for turning finance from a reporting function into a decision-courage system.
Tutoring Services
Looking for a Finance Leader who can control, explain & improve the business?
For international opportunities (remote, hybrid, or relocation) in financial control, finance transformation, FP&A, governance, or broader finance leadership, contact me directly.
Your information is used only to prepare the resume request email.
This preview does not transmit or store form data.